Heatmap
dashboard · 3 variants · pages: app, analyticsnpx shadcn-vue@latest add @trame/saas-heatmap # Vue
npx shadcn@latest add @trame/saas-heatmap # React-
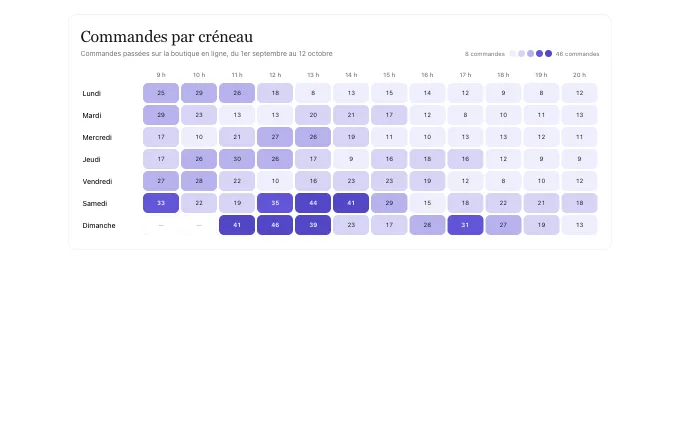 matrix
@trame/saas-heatmap--matrixa labelled grid with each value written in its shaded cell: cohorts and retention, hours by weekday, when the exact numbers are read
-
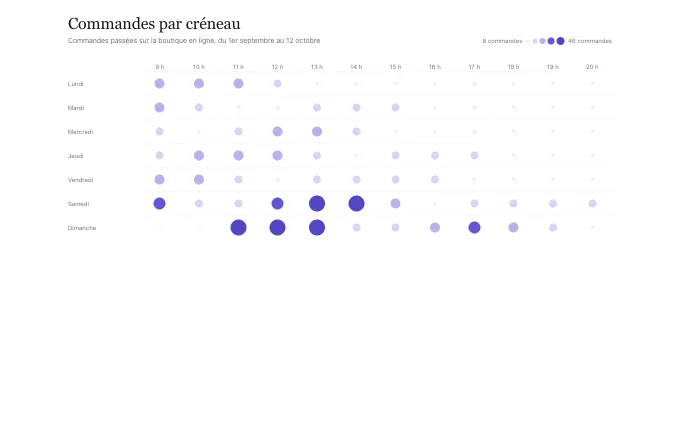 dots
@trame/saas-heatmap--dotsa quiet field of dots sized and shaded by value, for long periods read at a glance: occupancy, activity per day or per slot
-
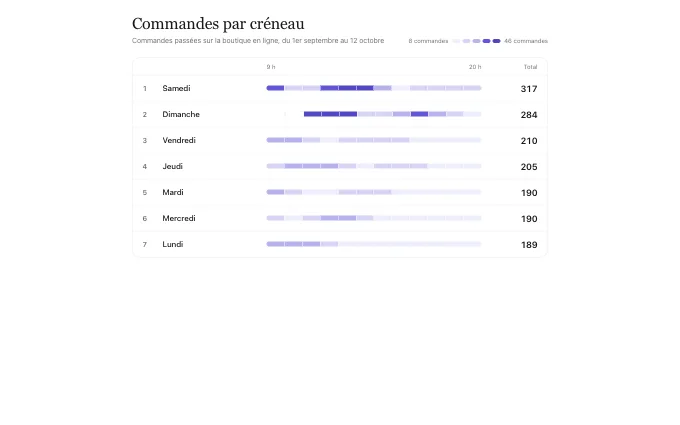 ranked-rows
@trame/saas-heatmap--ranked-rowsthe rows sorted by their total, each one a thin strip of its cells, when which row leads matters more than the columns