Report
dashboard · 3 variants · pages: app, analyticsnpx shadcn-vue@latest add @trame/saas-report # Vue
npx shadcn@latest add @trame/saas-report # React-
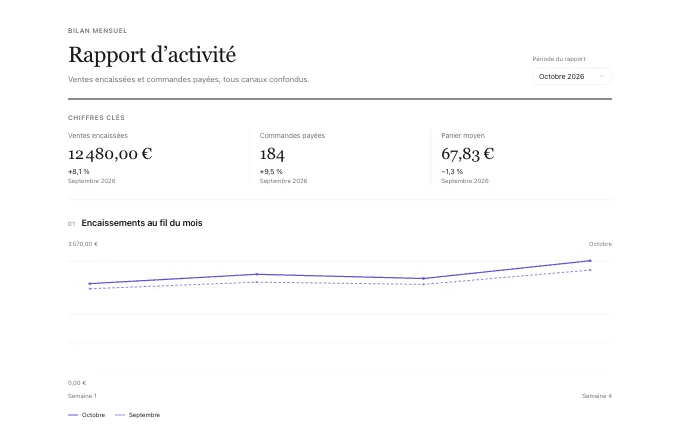 summary
@trame/saas-report--summaryA document-like overview of the merchant’s own period figures, followed by charts and the detailed breakdown.
-
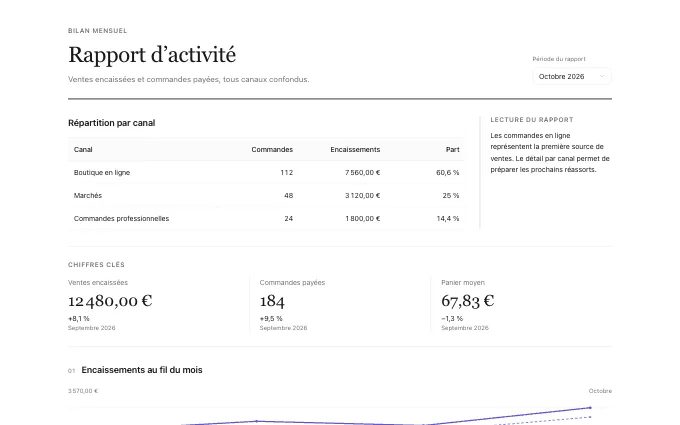 breakdown
@trame/saas-report--breakdownThe merchant’s own breakdown table leads beside a written reading, with charts as supporting evidence below.
-
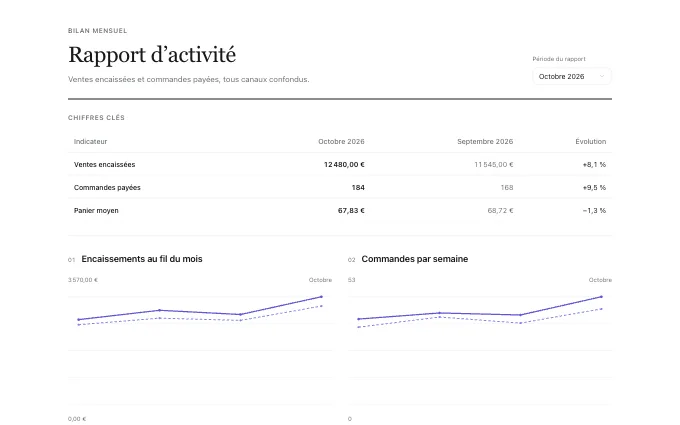 comparison
@trame/saas-report--comparisonThe merchant’s own current and previous figures are compared in a ledger above two aligned charts.